App engine charts Greasemonkey script
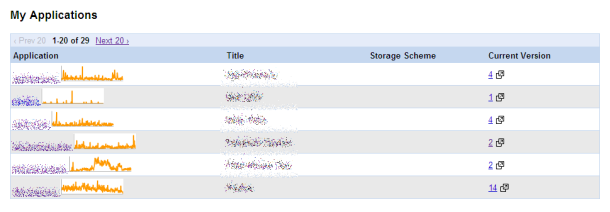
For everyone who manages more than a few App engine applications, this greasemonkey script adds an inline chart to each app-id on the dashboard. This way you don’t have to click through to each application page.
// ==UserScript==
// @name          GAE graphs
// @namespace     pratham.name
// @description   Adds inline graphs for GAE apps
// @include       https://appengine.google.com/
// @include       http://appengine.google.com/
// @require       http://ajax.googleapis.com/ajax/libs/jquery/1.3.2/jquery.min.js
// ==/UserScript==

function main() {
  $('a[title="view dashboard"]').each (function (index) {
		var link = $(this);
		var href = link.attr('href');

		$.get (href, function (data) {
			var str = data.match (/ae-dash-graph-img[\s\S]*chd=e:.*,(.*).chxp/i) [1];
			var url = 'http://chart.apis.google.com/chart?cht=lc&chs=100x25&chd=e:'+str;
			link.parent ().append (' <img src="'+url+'">');
		});
	});
}

// load jQuery and execute the main function
main ();
Note that this script uses the “require” feature of Greasemonkey, so it won’t work on Google Chrome.